5 minutes
Introducing the REx: Rule Explorer Project
![]()
The REx project is a collection and breakdown of several of the most popular open security detection rules for analysis and exploration, enabled by the powerful search and visualization capabilities of the Elastic stack! The docs can be found at rulexplorer.io .
The Detection Engineering Threat Report (DETR) is the visual component of the REx project, where the data speaks for itself, with minimal interpretive narration.
What is the purpose of the REx project?
This project provides a mechanism for interacting with various popular rule sets , in order to have a better understanding of the detection landscape, and quickly survey and compare multiple approaches.
Insights can be derived from data by looking at it from different perspectives, especially when done in a visual manner. The idea of this project is to view rule development, the detection engineering ecosystem, and the threat landscape from alternative lenses.
What is the Detection Engineering Threat Report (DETR)?
And why call it a report? It was organized and structured to be consumed as a report, albeit, an interactive and dynamic report.
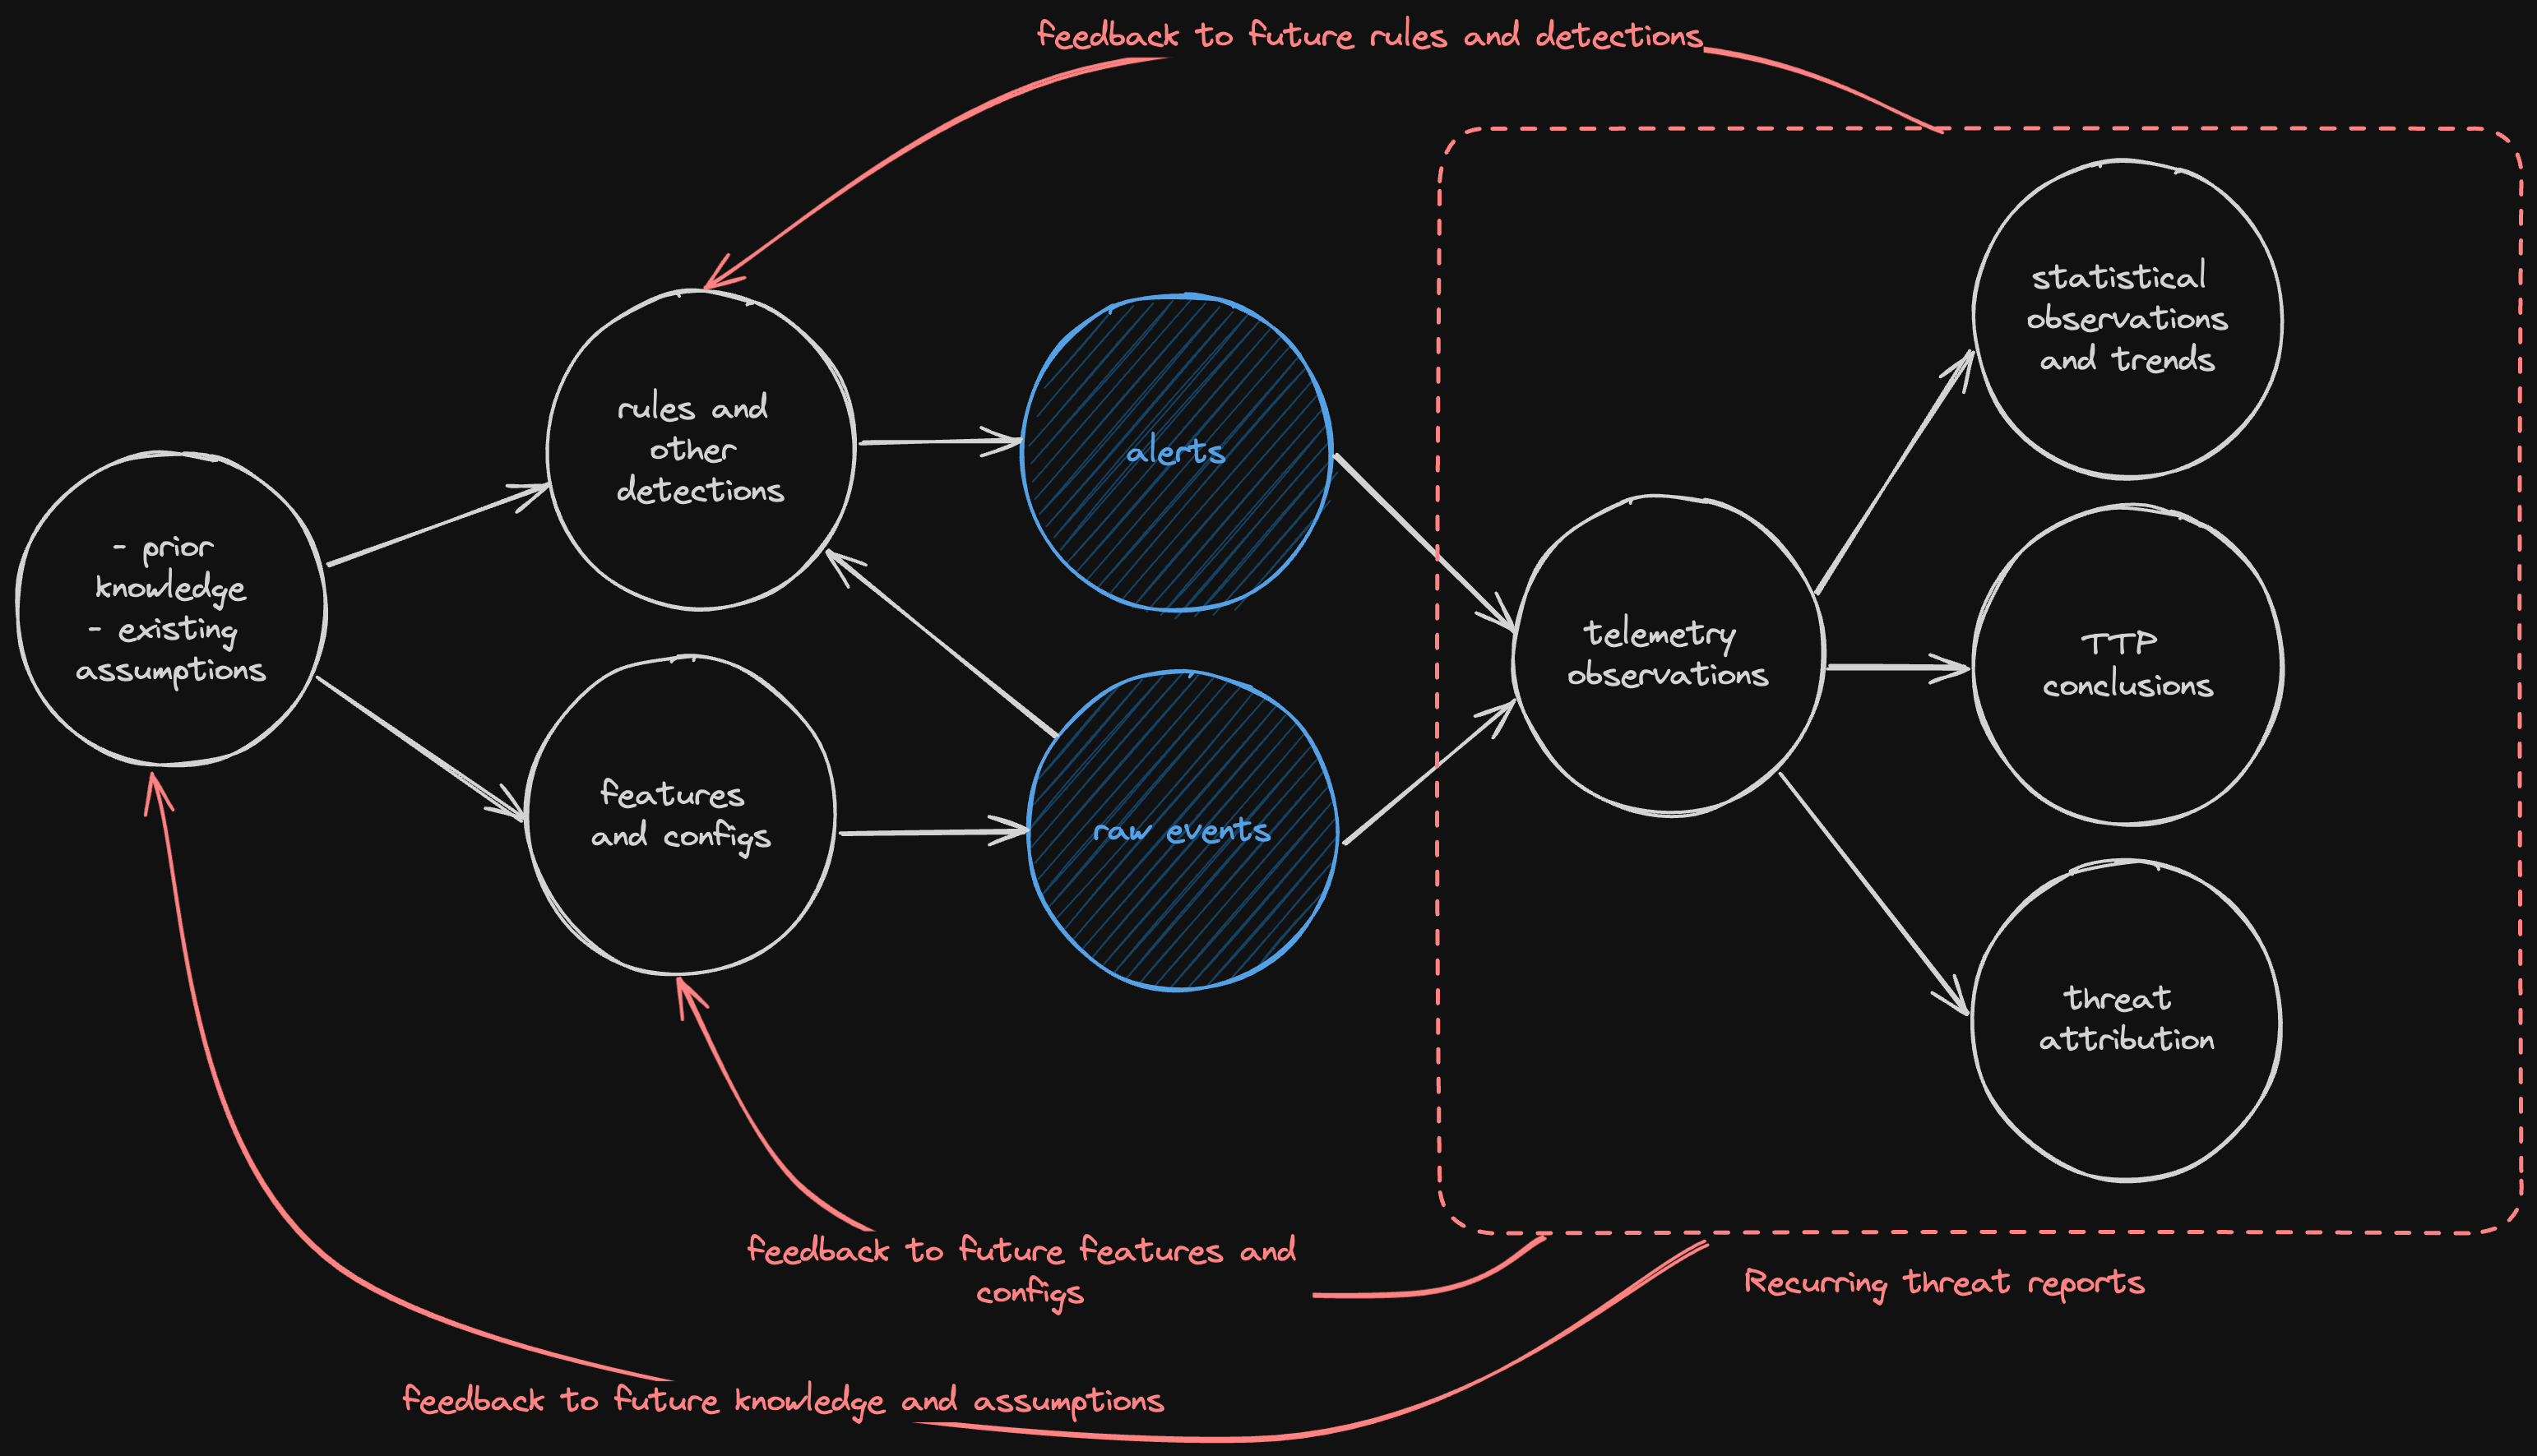
Like many in the industry, we constantly review and consume the various threat reports published by different vendors and projects. The normal flow for how the data is produced for these reports can be seen below. It is usually (at least in part) an aggregation and analysis of observed alerts and raw events within each respective environment or purview.
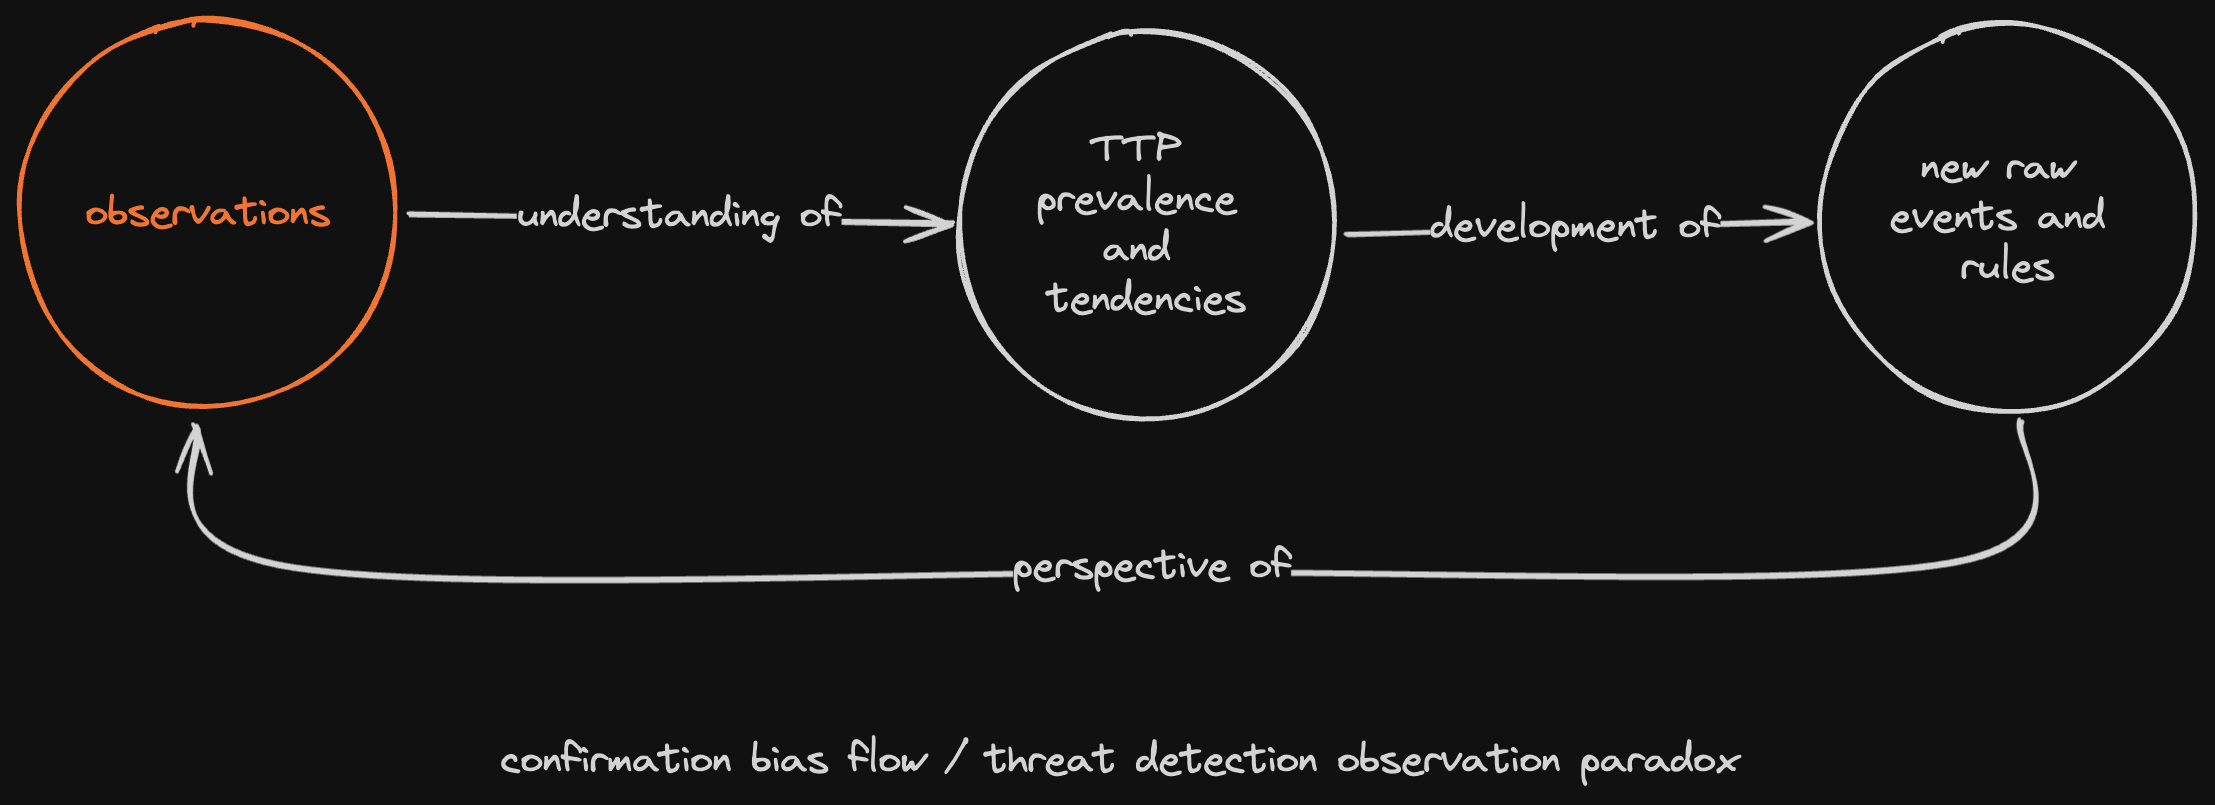
It is no secret that these reports and data are prone to confirmation bias, or authors over-focusing on their own assumptions or sources of information. Additionally, we are also aware of the risk of a feedback loop, where we see primarily what we look for, only, it is often overly-reinforced because we then consume information from other reports based on their own observations. This can be described as a threat detection observation paradox and can be seen below.
I think the industry does a pretty good job of controlling these biases, assumptions, and tendencies, so this is not meant to be critical of any approach. The idea is to attempt to ascertain additional perspective by peering into the process at a different point in the cycle. Focusing on threats through detection engineering efforts (rules), rather than from the triage and analysis (alerts).
It is not a uniquely discrete perspective, as these cannot exist without each other, just a shift up the spectrum.
As of this release, the DETR consists of the following sections:
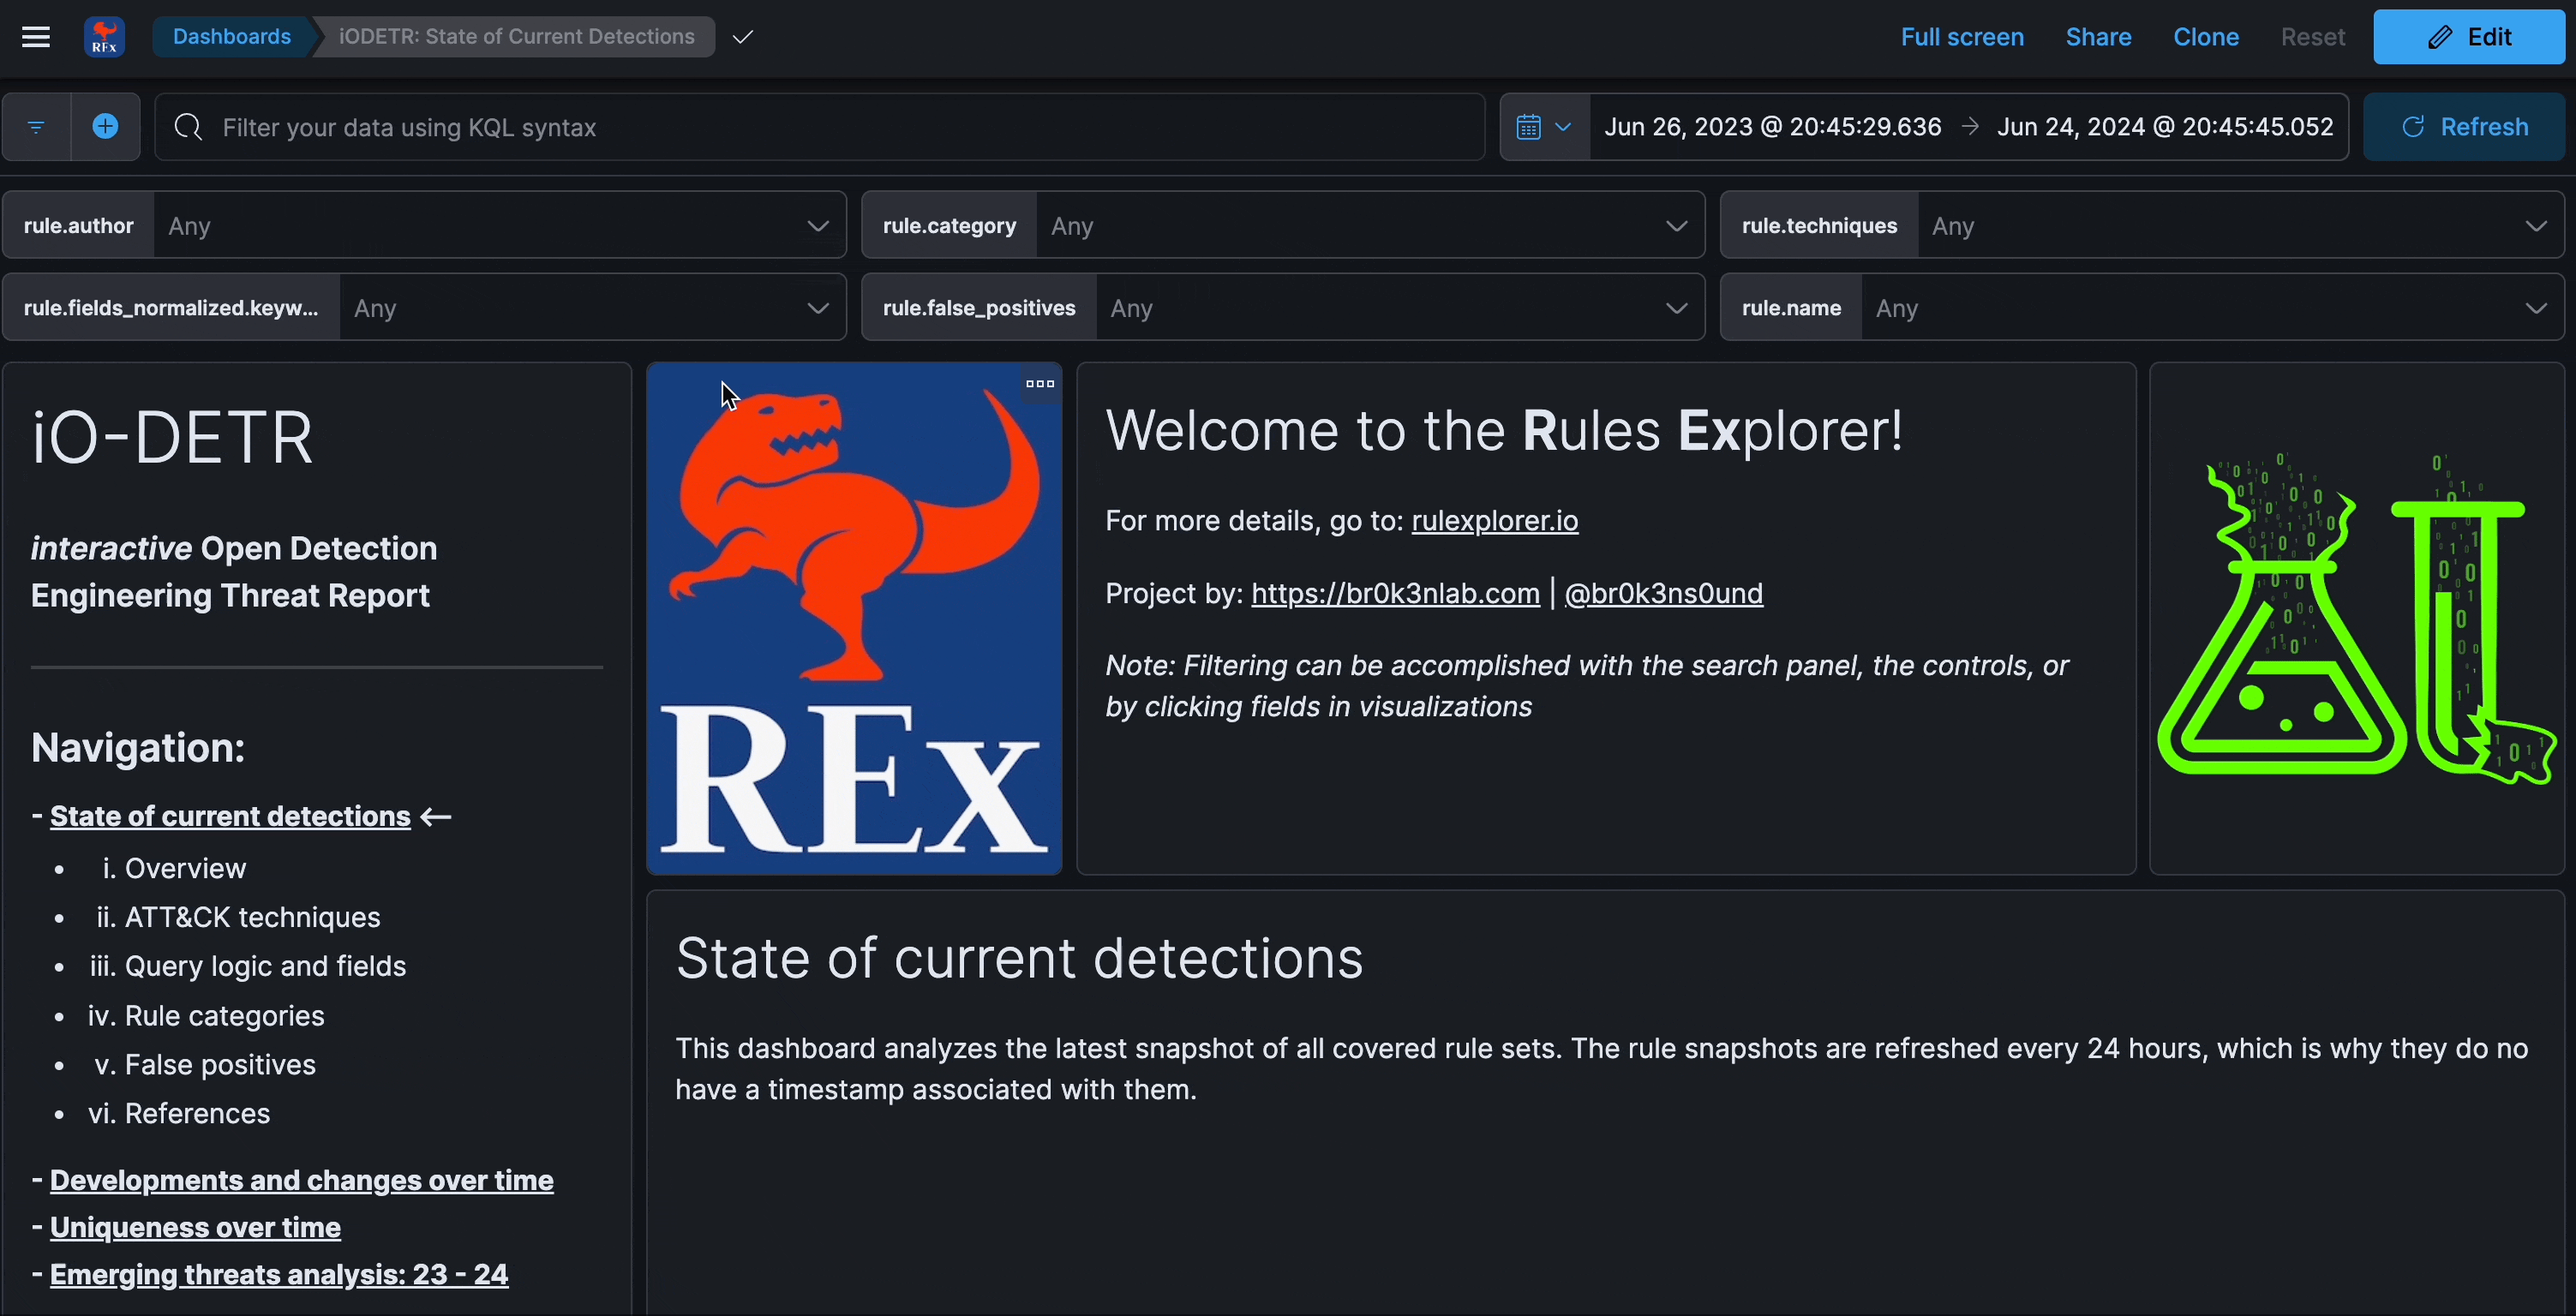
State of current detections
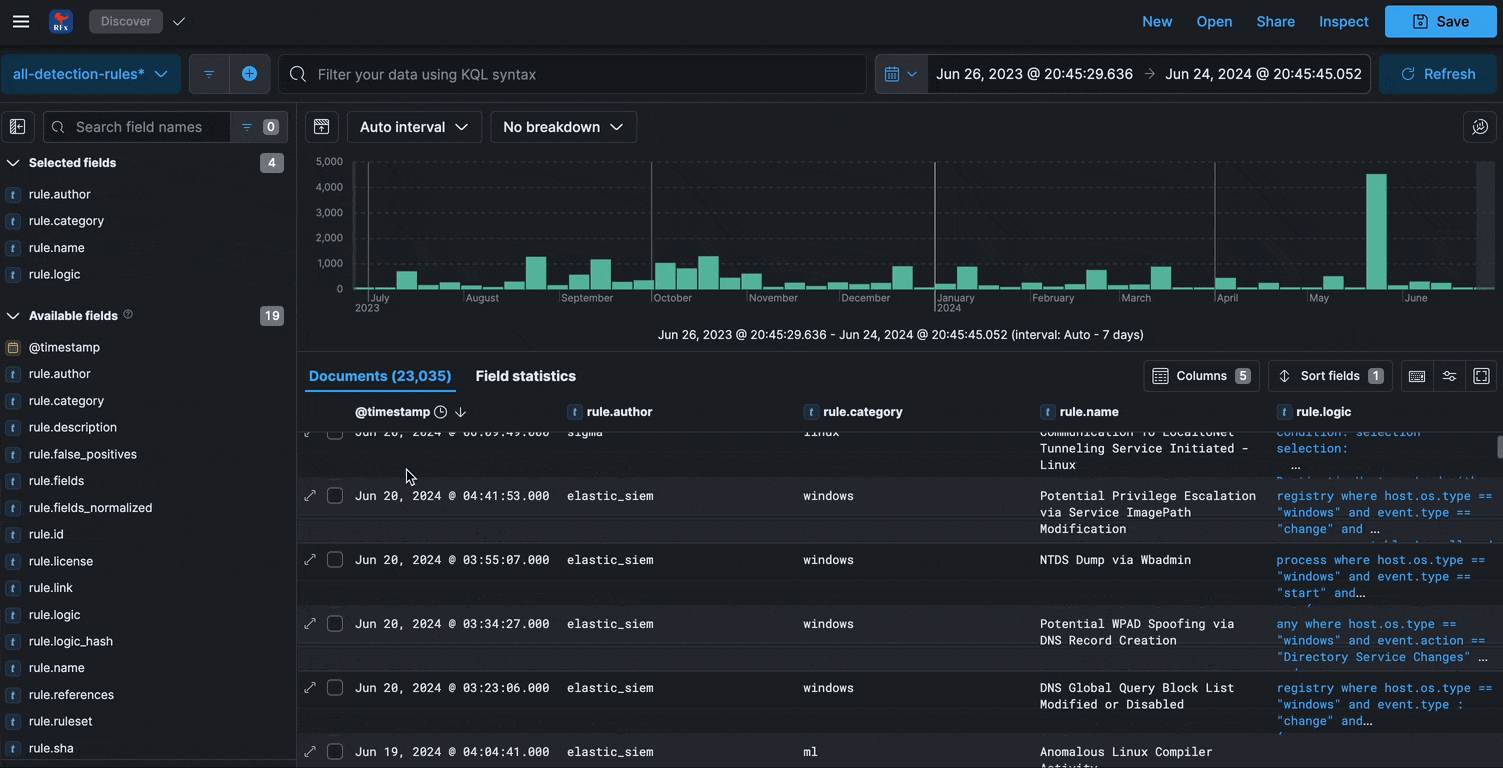
This section analyzes the latest snapshot of all covered rule sets. The rule snapshots are refreshed every 24 hours, which is why they do not have a timestamp associated with them.
Developments and changes over time
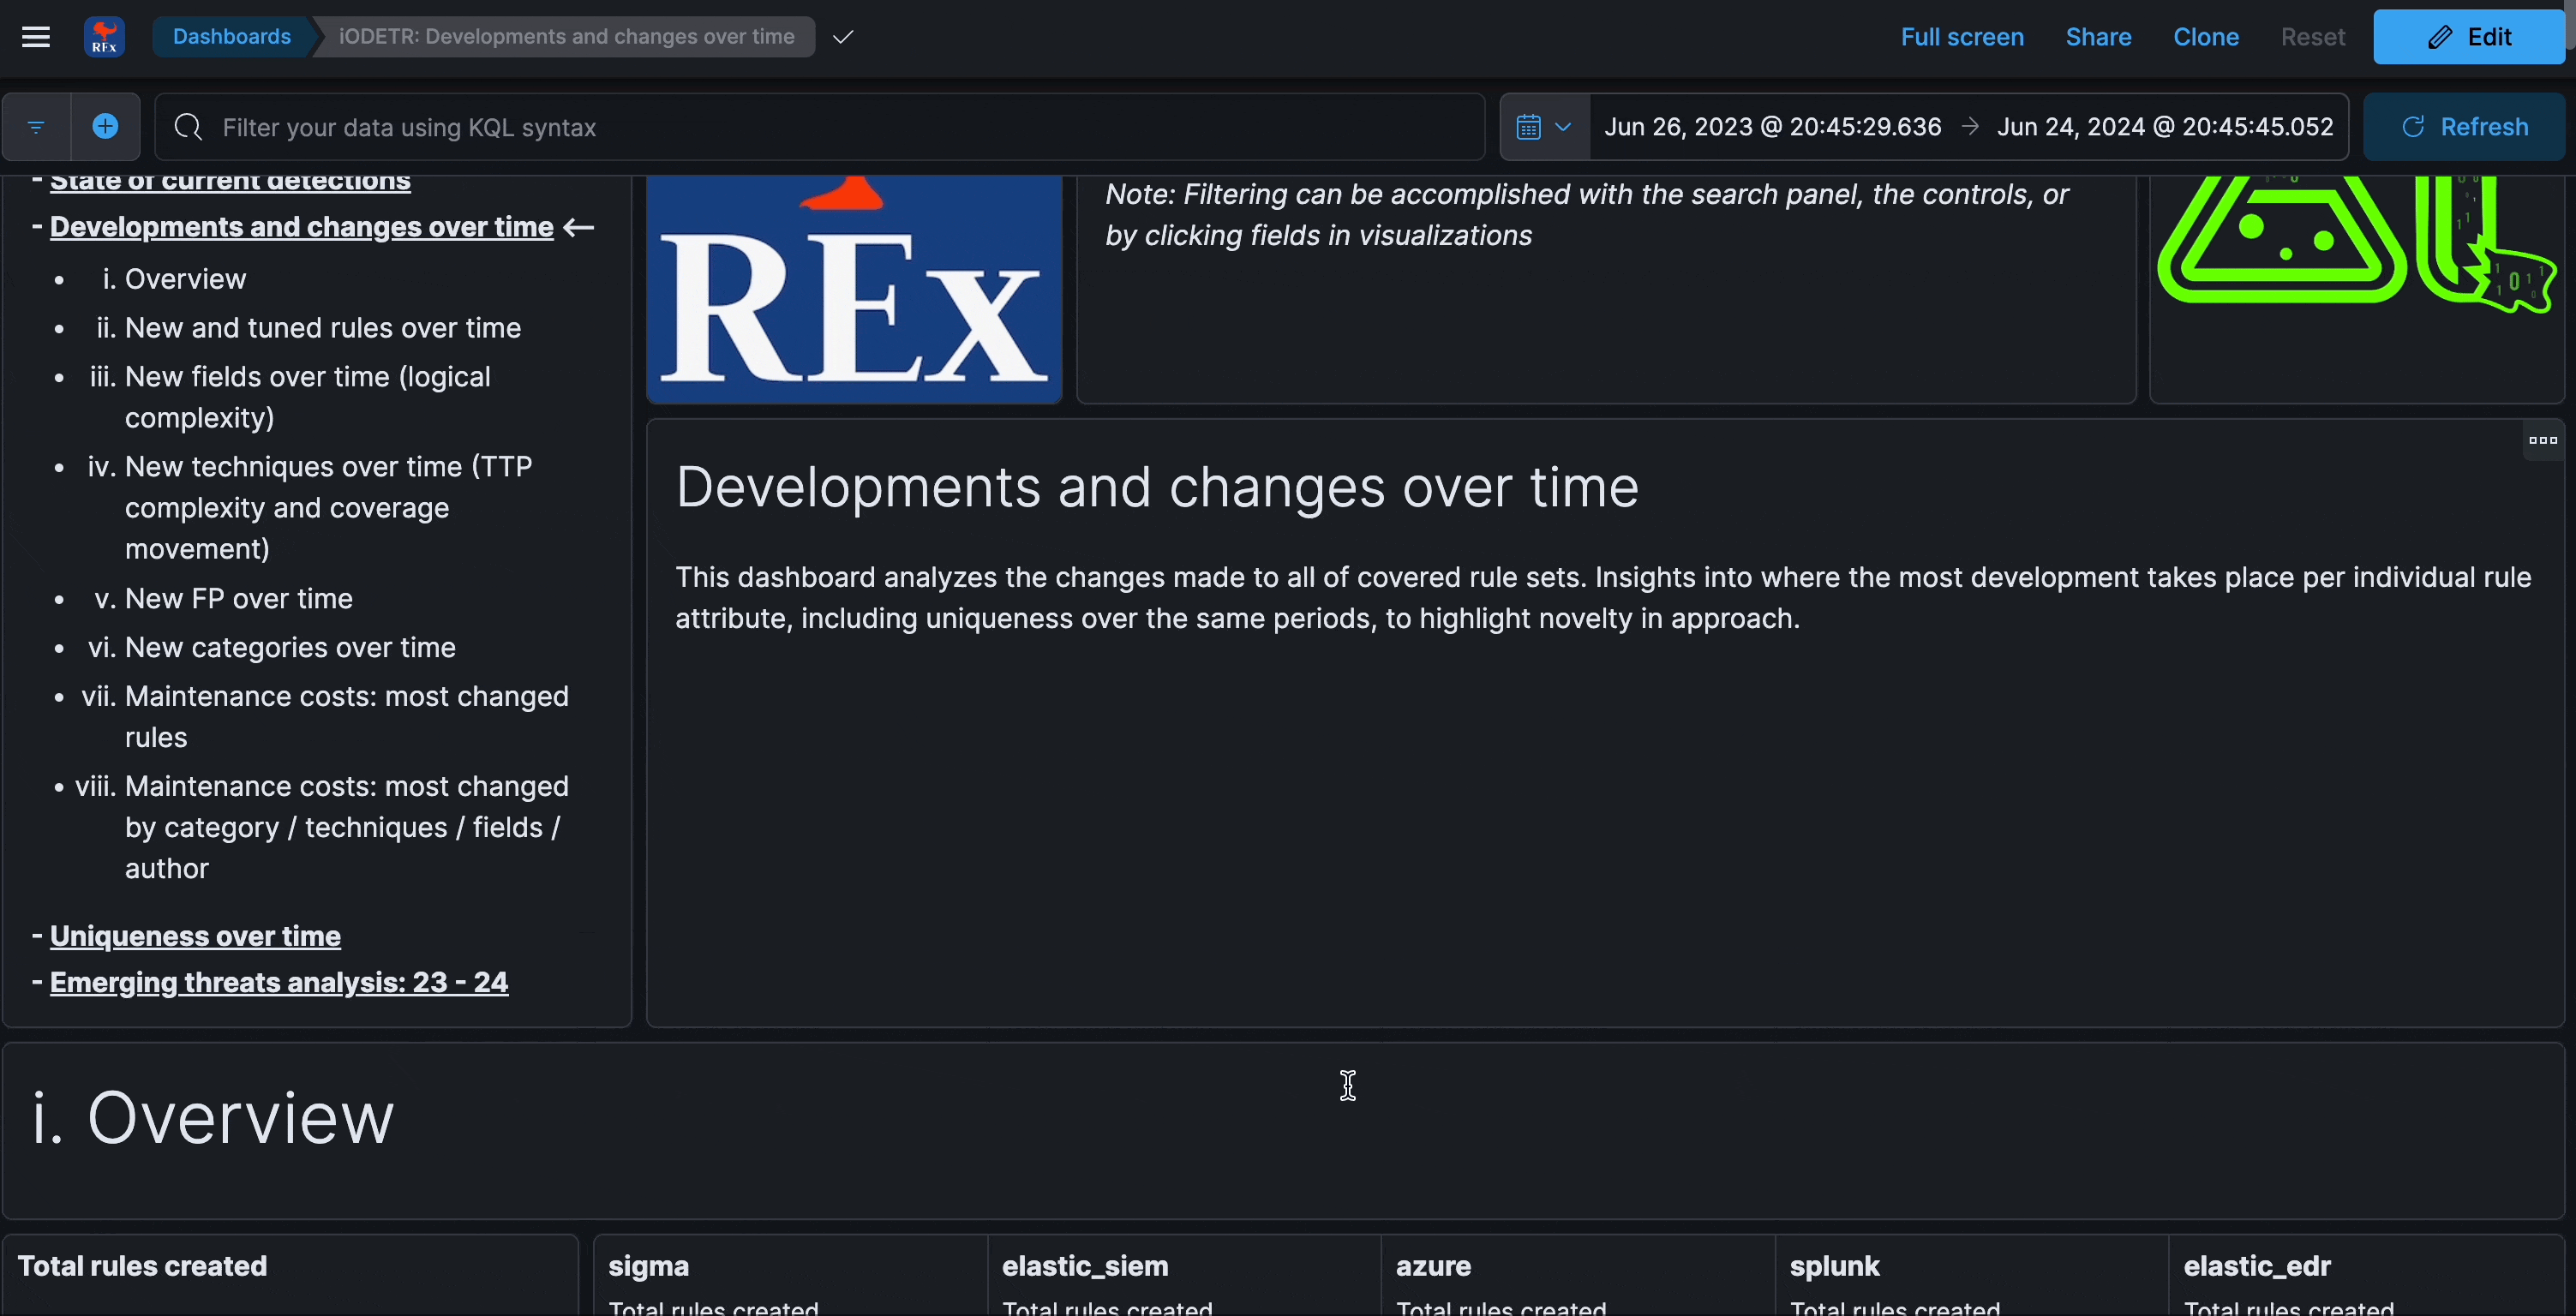
This section analyzes the changes made to all of covered rule sets. Insights into where the most development takes place per individual rule attribute, including maintenance perspectives.
The four types of unique changes (new terms) are:
- new detection logic fields detected over last 30d
- new detection logic fields by author detected over last 30d
- new techniques detected over last 30d
- new techniques by author detected over last 30d
Uniqueness over time
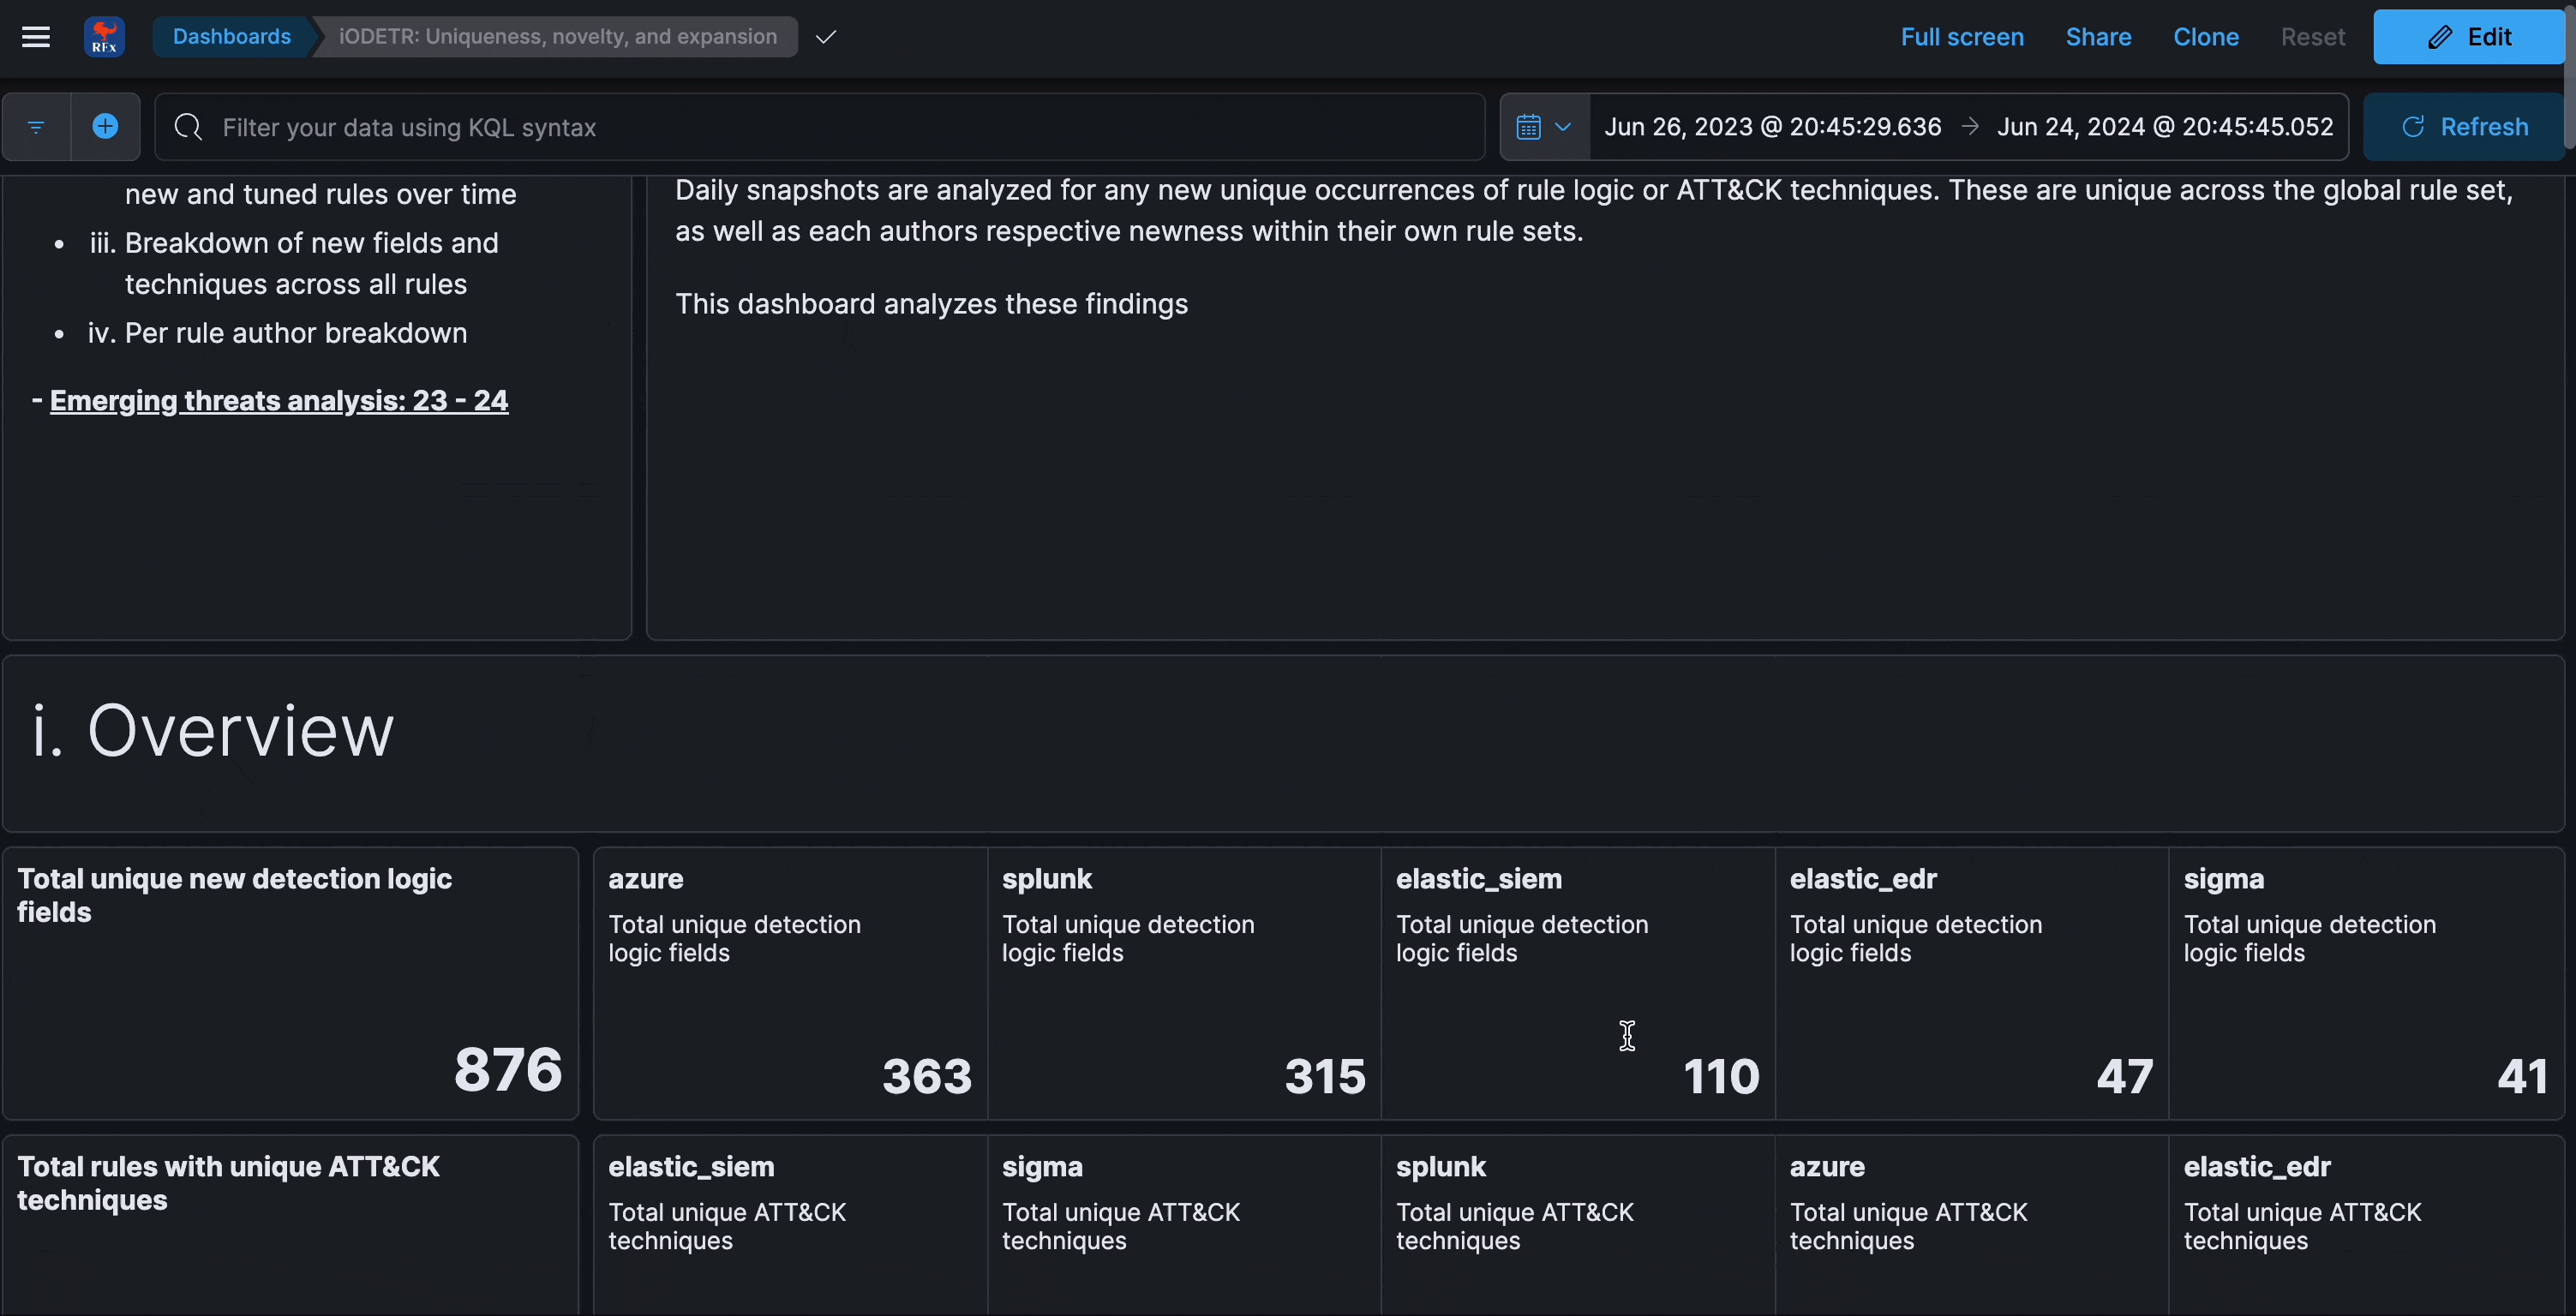
This section analyzes the uniqueness of detection logic fields and ATT&CK techniques within rules over time. It can be reflective of novelty, new datasources, or even just schemas that are too large.
Emerging threats analysis
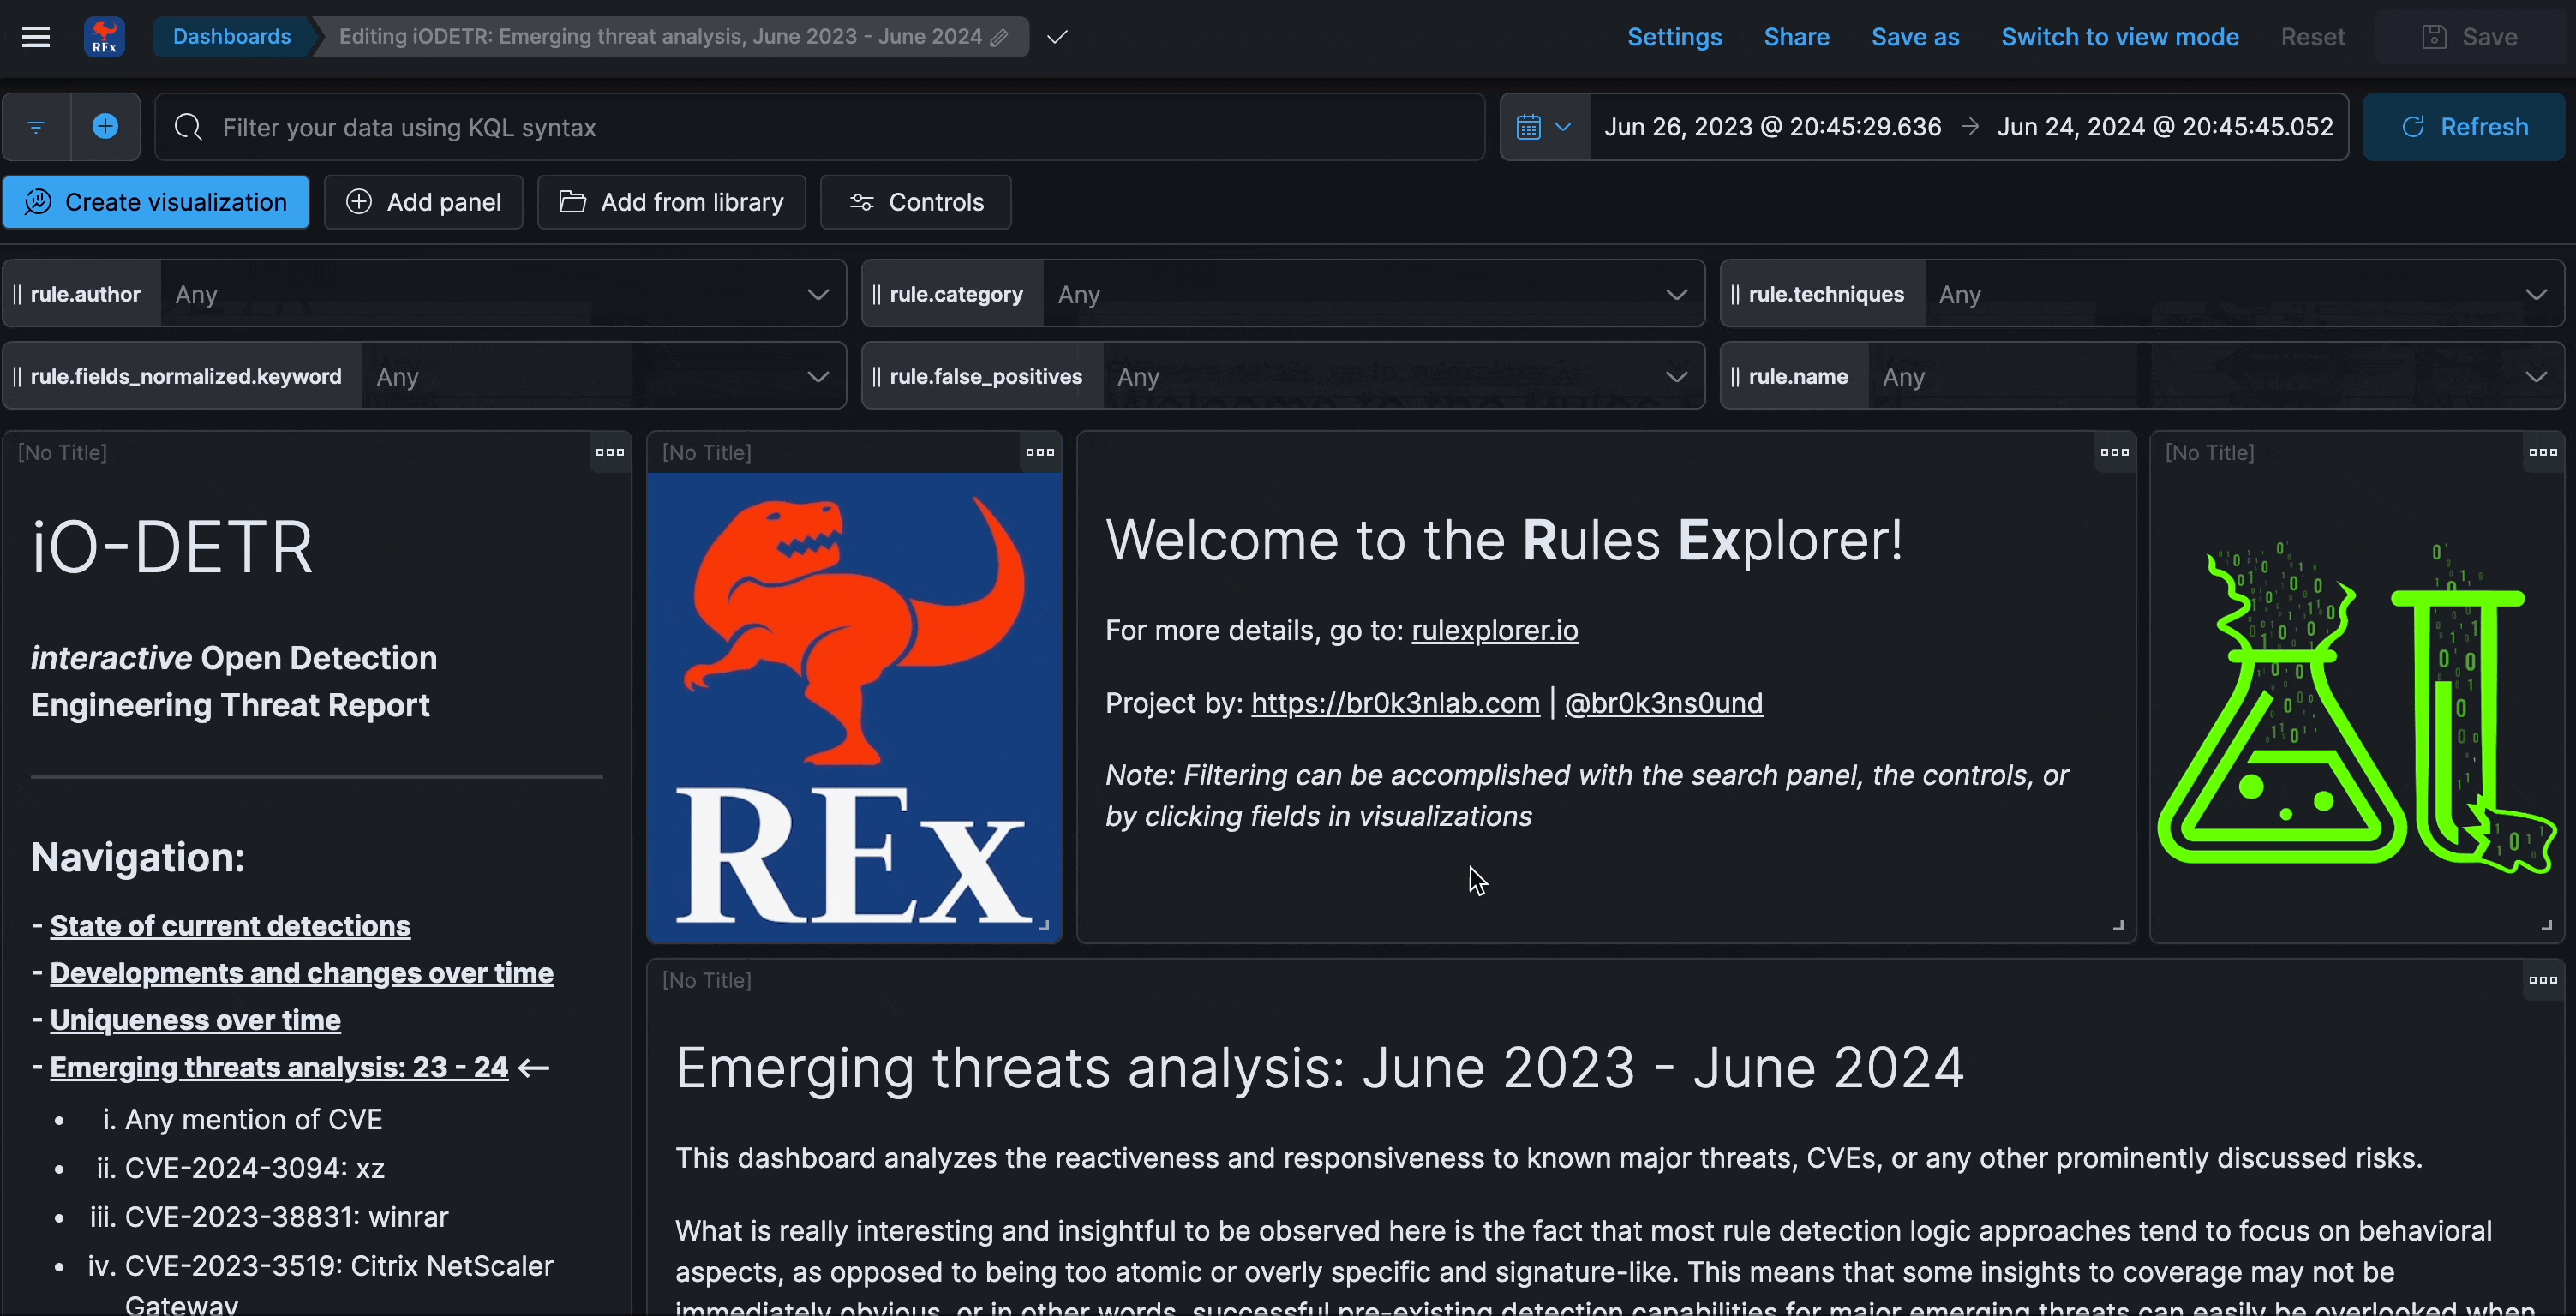
This dashboard analyzes the reactiveness and responsiveness to known major threats, CVEs, or any other prominently discussed risks.
What is interesting and insightful to be observed here is the fact that most rule detection logic approaches tend to focus on behavioral aspects, as opposed to being too atomic or overly specific and signature-like. This means that some insights to coverage may not be immediately obvious, or in other words, successful pre-existing detection capabilities for major emerging threats can easily be overlooked when inspecting from a purely rules perspective (as opposed to alerts).
The CVE’s chosen were the most represented in other threat reports. While they are insightful in themselves, they are also meant to showcase the process of temporal analysis - simply look up the timing of other CVE’s or events and compare accordingly.
What’s the goal?
Put simply, the goal is to provide a platform to easily analyze rules and the detection engineering ecosystem in new ways.
It may be helpful to think about the following personas when using this project:
- Security Analysts
- Threat Hunters
- Security Engineers
- Security Researchers
- Security Managers
Additionally, consider the following use cases:
- Rule Development Lifecycle
- Threat Landscape Analysis
- Maintenance Costs
- Threat Coverage
- Data Sources and Field usage
There are multiple ways to search and visualize the data, depending on specific need or perspective. To maximize insights and perspective, it is all about filtering and pivoting. Whether starting with a search in Discover or any of the dashboards as part of the DETR, you can filter down around observations or known events, such as the release of a CVE or exploit.
This is not meant to be a vendor or coverage comparison tool! Leave that to Gartner and Mitre. Coverage is a complex thing and each source has their own approaches and philosophies, which are better debated elsewhere. More rules does not always translate to more or better coverage.
For insights into creating high-quality, high-efficacy rules, check out the Zen of Security Rules.
Details
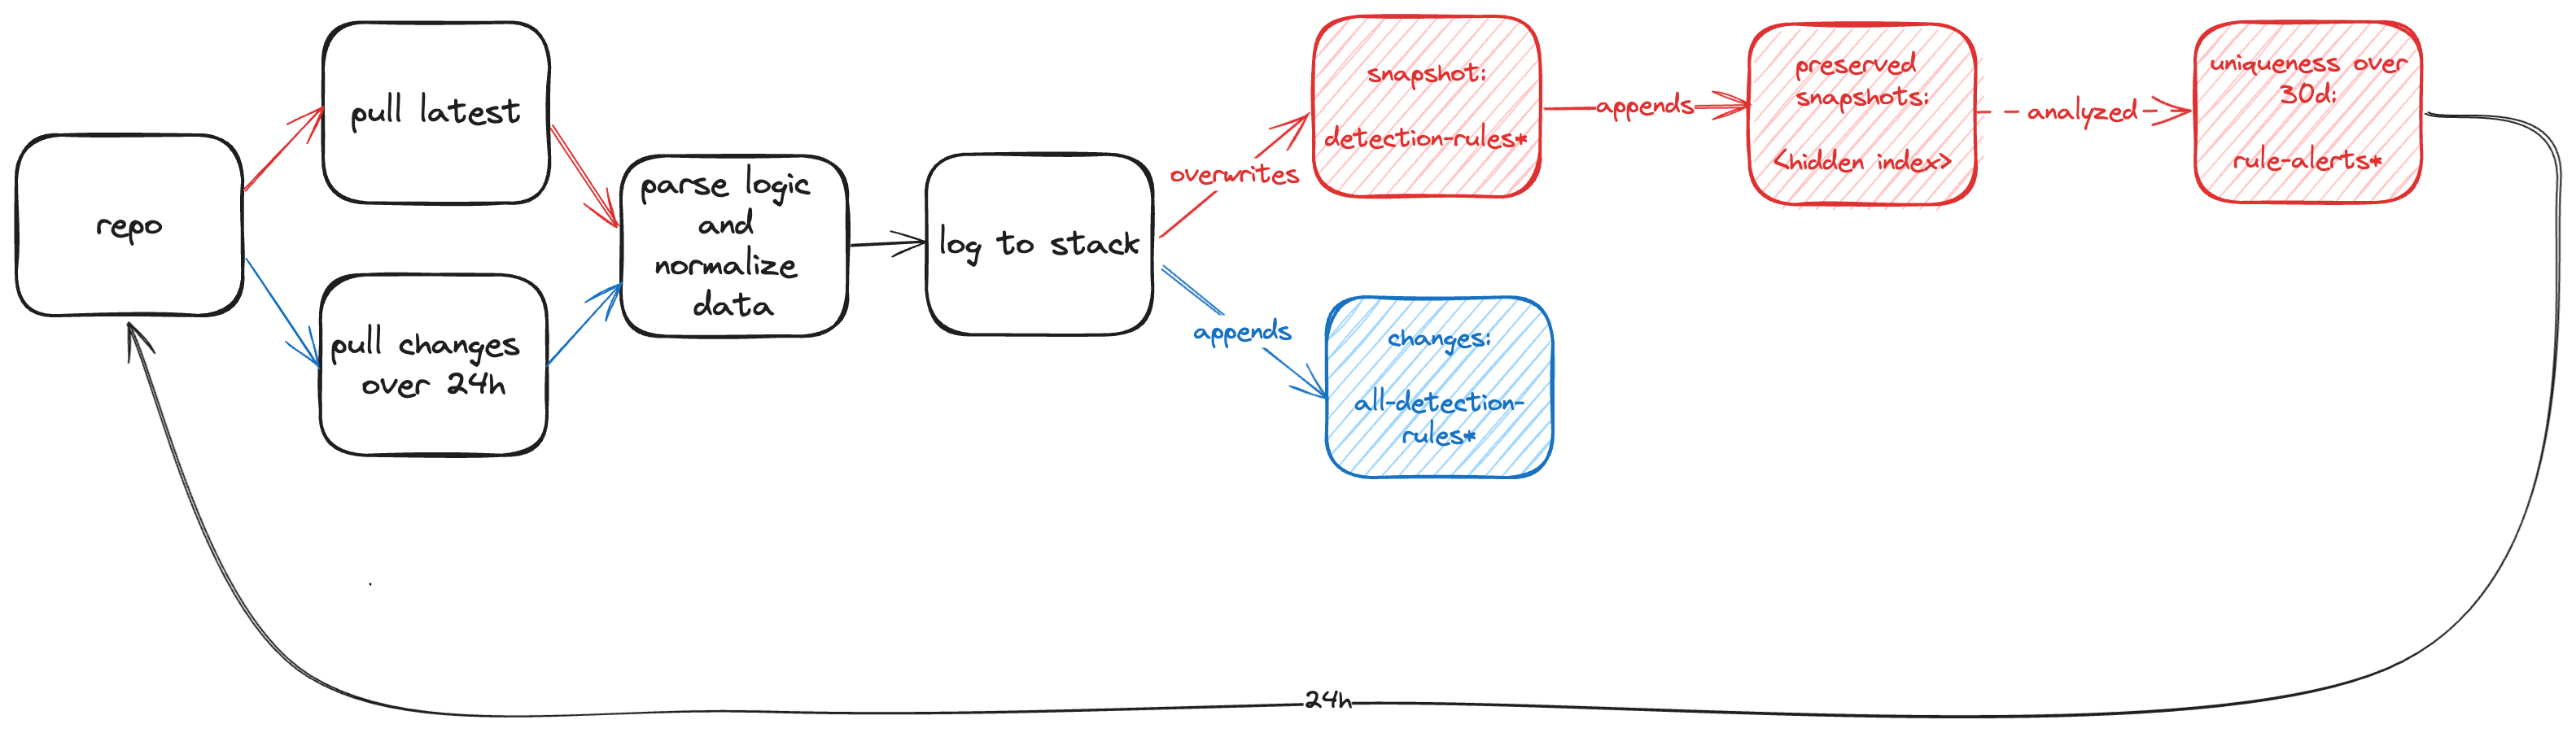
The data consists of:
- a snapshot of each respective repo’s primary branch
- all new and changed rule files over time
- unique techniques and fields from the detection logic
Every 24 hours, the latest snapshot of the rules in their primary repos is saved. Additionally, all modifications to rules over that time period is also saved within a different index. Finally, search results of unique techniques and fields over a 30 day period are also saved. The details of the schema, indexes, and data can be found in the schema docs . The rule logic is also parsed for additional in depth field analysis.
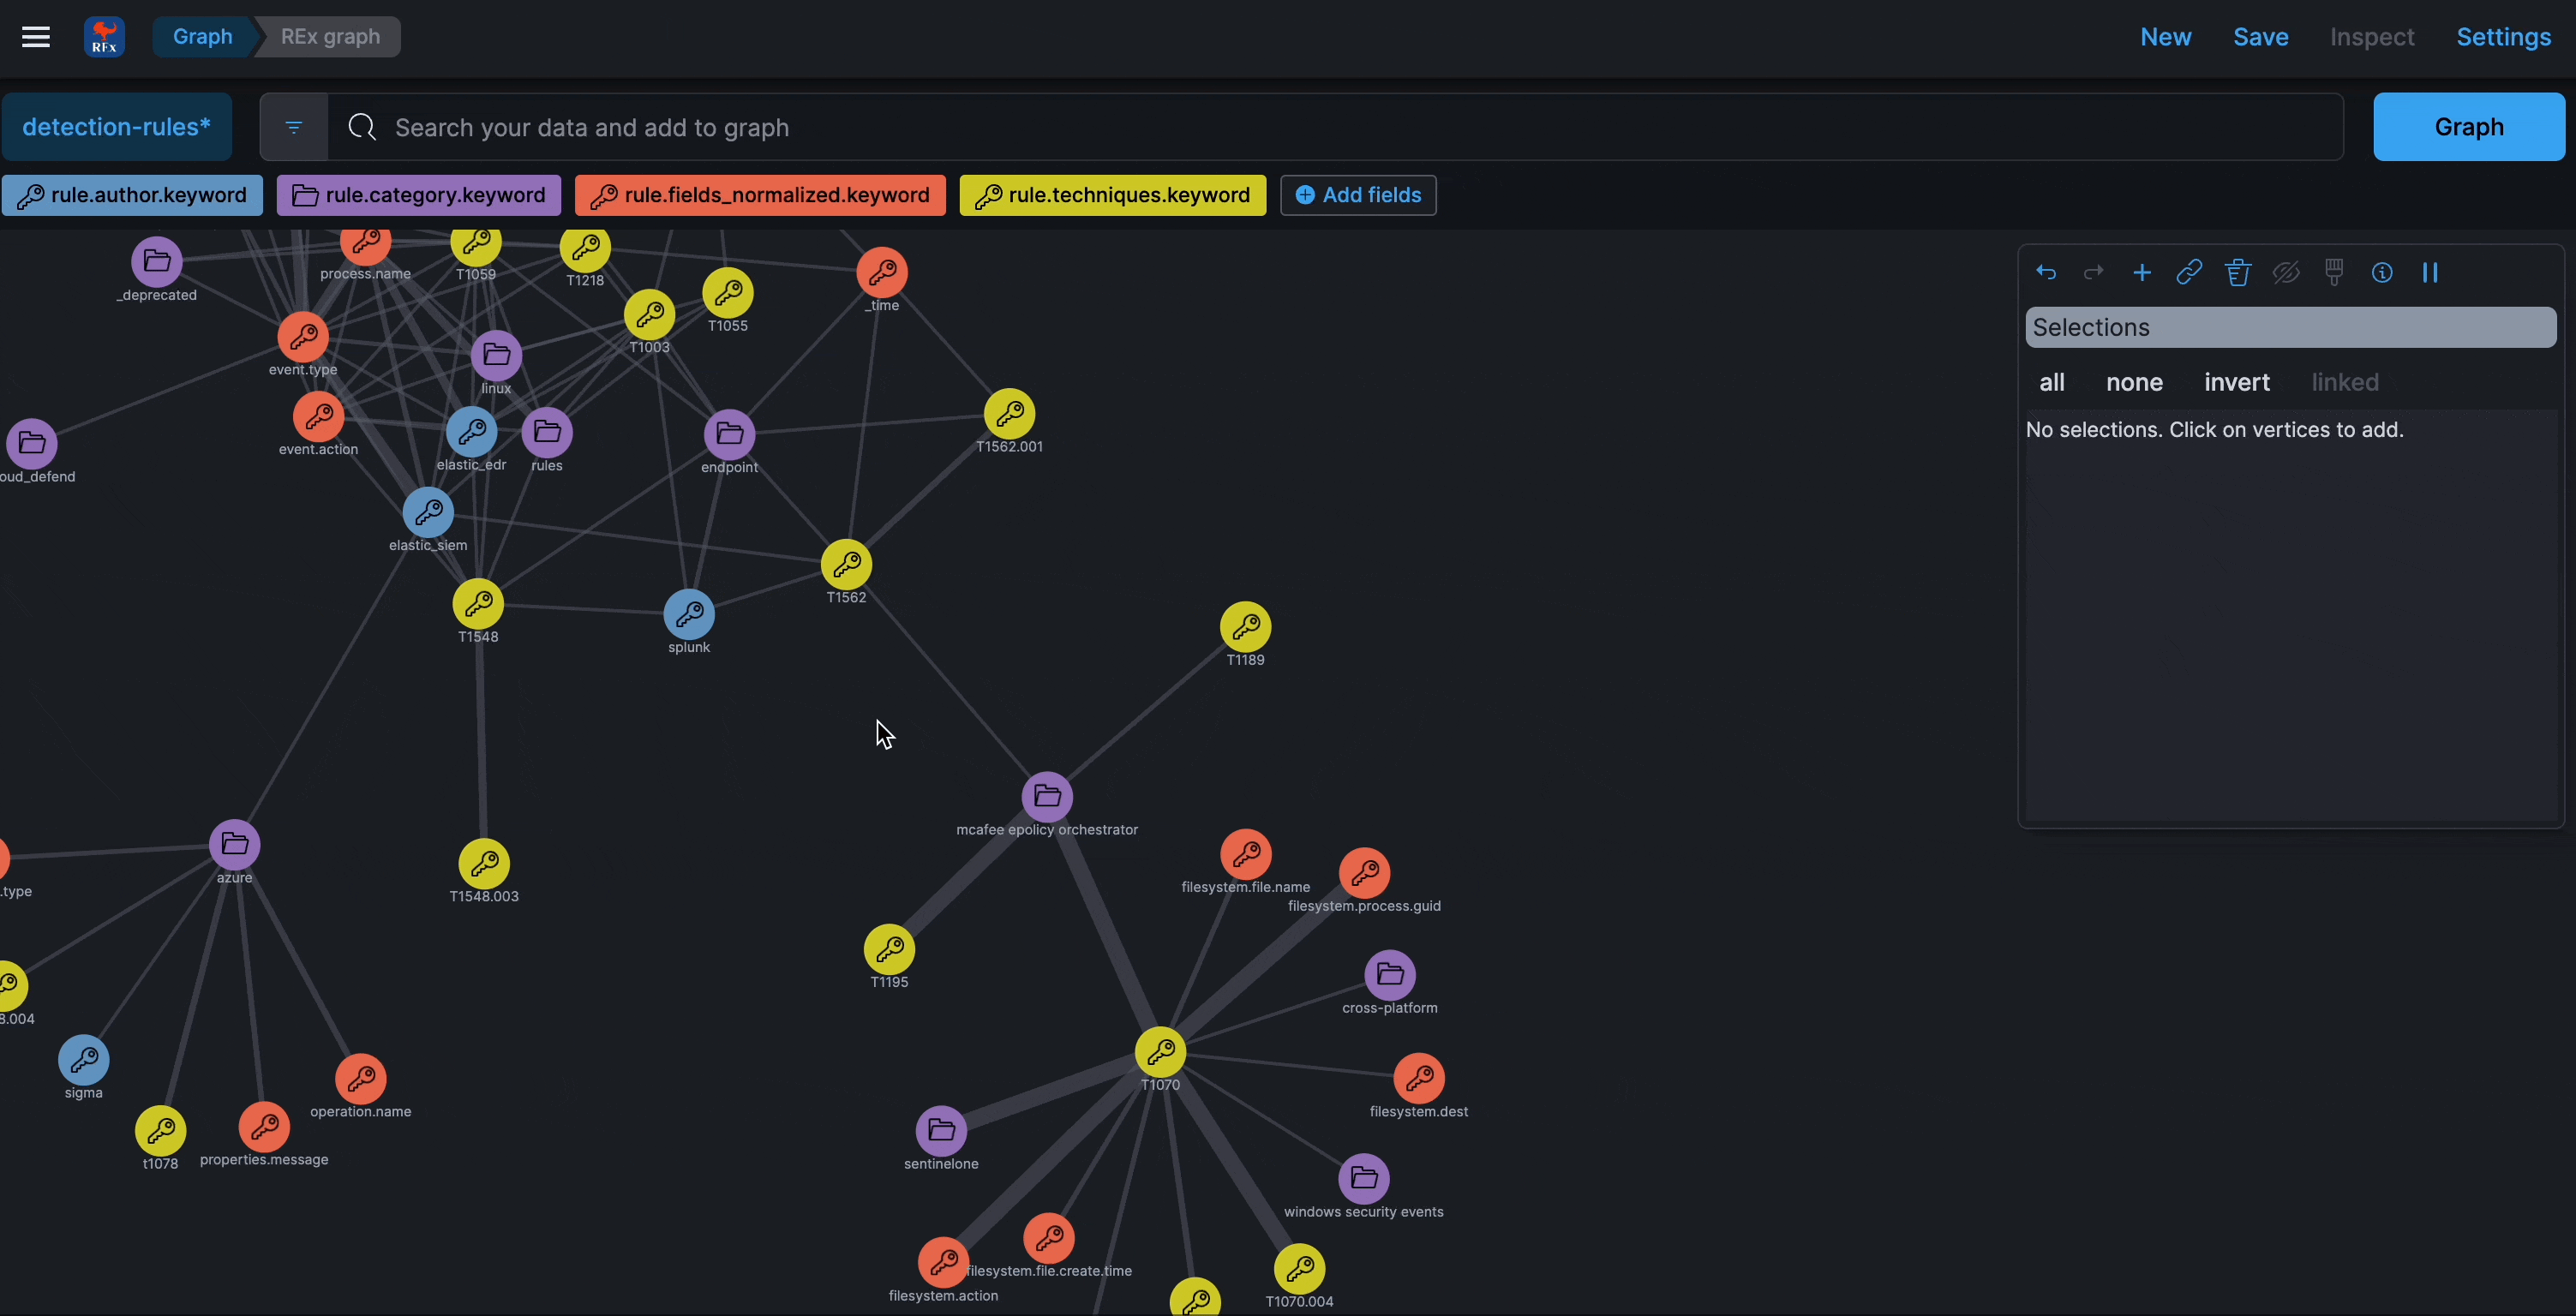
The Kibana features provided include:
Search
Visualize
Graph
Refreshed every 24 hours
Similar to the LoFP project, this is meant to be a maintenance-free project, and so the data remains fresh and auto-updates every 24 hours
Limitations?
As of this date, support for correlation Sigma rules still needs to be added.
REx DETR rules Kibana elasticsearch detection engineering rule metrics rule meta analysis
1038 Words
2024-07-15 07:16